
12 December 2019
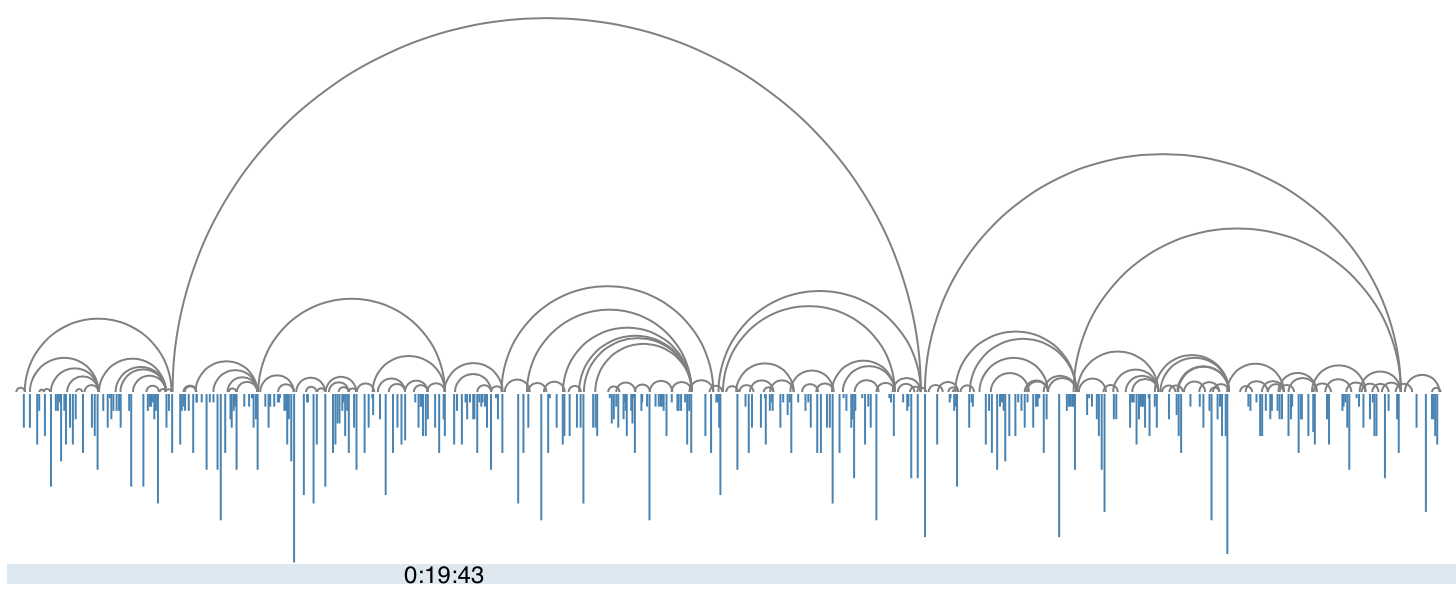
The source can be viewed here. The visualization is built in D3 on an Observable notebook. The stand-up routine that is being visualized is Ali Wong’s Baby Cobra. The data is from pudding.cool’s Github page.
The visualization can be divided into two halves. The upper half is the structure of the stand-up comedy routine which is displayed in the form of an arc diagram. The bottom half is essentially an inverted bar-chart with the x-axis as time and the y-axis as the length of laughter. Hovering the mouse over the blue line displays a timestamp(not completely accurate).